I spent an evening asking Claude Code eight questions. Behind those eight messages: 56 API calls and 5.5 million tokens.
That ratio is no mystery if you know how these systems work: the model is stateless, every call re-sends the whole conversation, caching absorbs most of it. But knowing the mechanism and watching it move through your own session are two different things — so I built a tool that reads the transcripts Claude Code already writes to disk and draws where every token went. This post walks the mechanism with my real numbers attached — not billing (I’m on a subscription; the tokens are included), just where context actually goes. Once it’s visible, a lot of vague advice (“keep prompts short!”) falls apart, and the real levers stand out.
The model has no memory
The single fact everything else follows from: a large language model remembers nothing between API calls. It’s a brilliant consultant with total amnesia.
So every time it’s asked anything — including by itself, mid-task, between two tool calls — the entire conversation so far is handed over again. Your messages, its replies, every file it read, every command output. All of it, every call.
The picture that made it click for me: the conversation is a stack of paper.
- New material goes on top of the stack.
- Pages already photocopied into a cache are re-read cheaply.
- Fresh photocopies are expensive.
- And the rule that governs everything: photocopies are only valid if the stack is unchanged from the bottom up. Slip one page into the middle, and every page above it must be re-photocopied.
Four kinds of token, twenty-fold apart
Every API call reports four numbers. They are not remotely equal in weight. Expressed as multiples of the cheapest meaningful unit (fresh input):
| Class | What it is | Relative weight |
|---|---|---|
| Cache read | re-reading already-filed pages | 0.1× |
| Fresh input | brand-new words, uncached | 1× |
| Cache write | photocopying pages into the cache | 2× |
| Output | what the model writes | 5× |
A 20× spread between the top and bottom of that table means raw token totals are almost meaningless. Here’s my session both ways:
By volume: cache reads were 91% of the 5.5M tokens. Alarming-looking number.
By weight: those same reads were 29% of the total. Cache writes — 7.7% of the tokens — were half the weight.
Cache reads are rent: a big number, lightly weighted, unavoidable. Cache writes are what a session actually spends on. So the whole question of session efficiency collapses to one question:
When does the cache get rewritten, and why?
The expensive event: cache rebuilds
A rebuild has an unmistakable signature in the data — cache reads collapse, cache writes spike. My one session contained all four causes:
| Cause | Cache read before → after | Write spike |
|---|---|---|
| Switching models mid-session | 75,792 → 29,910 | 35,977 |
| Idle gap (~50 min, cache expired) | 65,887 → 29,923 | 40,551 |
Running /compact | 107,585 → 35,481 | 36,828 |
| Turn boundary (me sending a message) | 111,991 → 35,481 | 77,692 |
| Turn boundary (again) | 129,934 → 35,481 | 95,537 |
Two rows in that table are worth staring at — both are things you’d predict from the byte-identical rule, and both are satisfying to see land in the data exactly as predicted.
First: walking away is a cost. I left the session idle for ~50 minutes. The cache expired. The next call re-filed 40k tokens of context at the 2× rate — the same tokens it had been re-reading at 0.1× moments before. Same context, 20× the weight, purely from timing. Switching models mid-session does the same thing.
Second, and this is the headline: the turn boundaries — me, typing a message — were the two biggest events in the entire session.
The model working is cheap. You talking is expensive.
Of my 56 API calls, 48 were the model running tools — reading files, running commands, iterating. Inside one of those runs the conversation only grows at the top of the stack, so caching is near-perfect. The model can grind through dozens of calls for less weight than one rebuild.
The other 8 calls sat at turn boundaries — the seam right after I sent a message. At every one of those seams, something changes in the middle of the stack, the byte-identical rule kicks in, and everything above that point gets re-filed at 2×.
And the arithmetic is exact. When a rebuild happened, the surviving cache floor plus the rebuilt portion equalled the next call’s cache read to the token:
35,481 (surviving floor) + 77,692 (rebuilt) = 113,173 → next call's read: 113,173 ✓
35,481 (surviving floor) + 95,537 (rebuilt) = 131,018 → next call's read: 131,018 ✓
Nothing approximate about it. The whole stack gets re-photocopied and handed back, complete.
Which yields the rule that’s implicit in every caching doc but rarely stated outright:
Each message you send costs roughly (current context − cache floor) × 2, in token-weight. And it grows as the session grows.
A question at call 5 is cheap. The identical question at call 50 re-files fifty calls’ worth of accumulated history. The session gets more expensive to talk to the longer it runs — not because the model changed, but because the stack got taller.
What /compact actually does
/compact gets described as “freeing up context.” The data says something more specific: it’s an investment with a payback period, counted in calls.
Mine threw away 107.6k tokens of history, wrote a 35.5k summary in its place, and bookmarked it. One-off cost: ~37k tokens at the write rate. Ongoing saving: ~72k fewer tokens re-read on every subsequent call. It broke even after about 10 calls; 26 followed, so it paid for itself comfortably.
Two things it does not do:
- It refunds nothing. The cumulative total only ever grows.
- It doesn’t stop the future. Twenty calls later my context was 131k — 22% above the pre-compact peak. Compact deletes the past; new work re-inflates the stack regardless.
But there’s a subtler win. Remember those two expensive turn-boundary rebuilds? Both landed after the compact — and each re-filed the 35k summary instead of the 108k history it replaced. The compact made every later rebuild permanently cheaper. In my session that accident insurance was worth about 4× the compact’s own cost.
One distinction worth keeping: a rebuild changes the rate you pay for context, once. A compact changes the amount of context, forever.
And for genuinely unrelated work, skip compact entirely and /clear. Compact has a floor — the summary plus everything under it — and repeated compaction ratchets that floor upward in a sawtooth that never returns to zero. A fresh session is cheaper than it looks: the system prompt and setup prefix stay cached even across sessions, so re-warming costs almost nothing. Compact preserves continuity; clear preserves capacity.
Tool output is a subscription, not a purchase
Every byte a tool returns lands in the stack and gets re-read on every remaining call:
true weight of a tool output ≈ its size × the number of calls left in the sessionA 33k-token log file read early in a session with 1,000 calls still to come becomes 33 million cache-read tokens before the session ends. The same read on the last call costs 33k. Position matters as much as size.
The practical moves: grep for the verdict line instead of dumping the log; read line ranges, not whole files; push heavy reading into subagents, which start with an empty stack and return a summary instead of the raw pages.
A trap for anyone measuring this themselves
If you point a script at Claude Code’s transcript files (plain JSONL in ~/.claude/projects/), know this: the transcript rewrites each assistant message several times while it streams. The same message ID appears on multiple lines, each with a usage block. Sum naively and every number comes out roughly double.
The fix is one line of jq — keep only the last record per message ID:
group_by(.message.id) | map(.[-1])This is the single most common way a hand-rolled token counter goes wrong, and it’s invisible unless you validate against a known total.
The rules that fall out
- Batch your questions. Three short messages are three full rebuilds; one message with three questions is one.
/clearbetween unrelated tasks;/compactwithin a task — and compact early enough that the remaining calls earn it back.- Don’t switch models mid-session unless you mean it.
- Don’t walk away mid-session past the cache lifetime — it costs the same as a model switch, for nothing.
- Keep tool output small. Its true weight is size × remaining calls.
- Push heavy reading into subagents. They start at zero.
- The longer the session, the more each message costs. Long sessions punish chattiness specifically, not usage generally.
None of this required inside knowledge — just reading the transcripts the tool already writes to disk, carefully, with the dedup trap handled.
I’ve packaged the measurement tooling as an open-source Claude Code plugin — an HTML report per session, rebuild detection with the cause attributed from the data, and a live status line that sits under your prompt while you work:
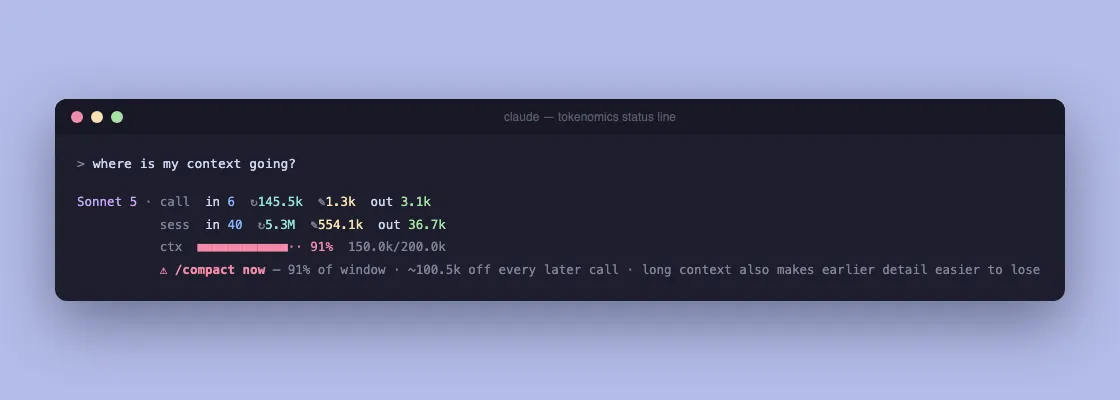
Row one is the last API call, row two is the session so far (↻ cache read, ✎ cache write), row three is the context window, and the last row is a /compact nudge that only appears when the numbers justify it — it states what a compact would take off every later call, measured from your actual session, not a rule of thumb. Token counts only; nothing here ever asserts a price.
Installing it is one sentence — paste this into Claude Code and it does the rest:
install the tokenomics plugin from github.com/Priyadarshiswain/tokenomicsEverything else — setting up the status line, the compact nudge, uninstalling cleanly, and the full write-up of the mechanism — is in the README.
Point it at your own sessions. Your ratios will differ; the structure won’t.
One session, 5.5M tokens, measured with the tool it turned into. Figures are one real session’s, an illustration of the mechanism rather than a benchmark.